This blog post discusses the operationalization of machine learning systems. From an engineering perspective, these systems pose enormous challenges due to the high variability of requirements that different use cases have. As the machine-learning maturity of organizations evolves, the complexity required to manage these systems grows exponentially; The proliferation of ML frameworks makes it hard to abstract layers of common functionality and, consequently, automating the whole process becomes even harder.
As regulators move towards giving consumers the “right to explainability” and the “right to model retraining”, compliance requirements bring a new dimension of complexity to the processes.
Ideally, organizations should have standardized processes by which they can deliver ML services. This requires an ML ecosystem/platform that considers the following (nonexhaustive) properties:
-
Scalability - Working with samples and small datasets is sometimes enough in the initial research phase. However, teams eventually require to have access to distributed data processing and model training. Furthermore, we might need to data pipelines and models at scale. The underlying platform-infrastructure is responsible to provide this capability.
-
Framework Agnostic - Teams should have the flexibility to use any required tool; this is particularly relevant as frameworks become more specialized. This also minimizes code-rewrites between research and operations which is highly error-prone.
-
Modular - The platform should provide primitive components that can be used by the engineering teams to deliver ML on a standardized way. We must identify commonalities for modularization.
-
Governance - From a technical point of view, we need enough evidence to prove that the delivery process produces artifacts that are reproducible, traceable, and verifiable. Further, there are complex ethical, legal, conduct and reputational issues associated with the use of personal data. For example, are data being used unfairly to exclude individuals or groups, or to promote unjustifiably privileged access for others? Controls are needed to ensure data is treated fairly.
We are going to propose a technology stack for an ML-platform solution that can describe workflows respecting these desired properties. The following diagram illustrates the different components/primitives involved, which we are going to discuss:
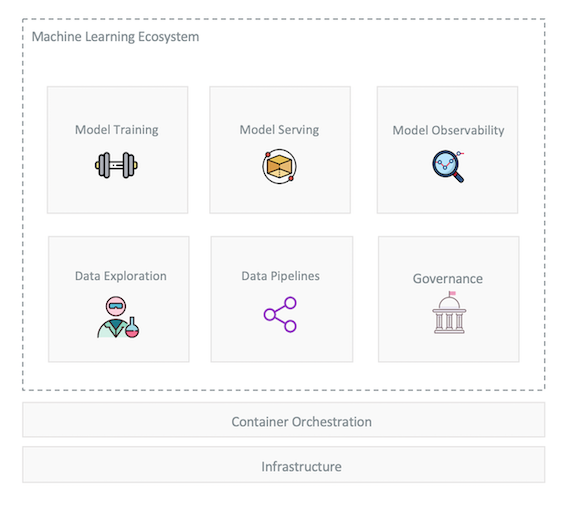
ML Primitives
Lets briefly describe the responsibilities of each modular component. We’ll also look at the current technology landscape and suggest tools that can solve the challenges posed by each layer.
Model Training
Training machine learning models can be a highly time-consuming task. It can also be demanding from a resource allocation perspective, since bigger datasets and sophisticated models might require considerable amounts of processing power, which sometimes needs to come in specialized form, e.g. GPUs, TPU, etc.
As Auto Machine Learning technology improves, the process by which we select a model, along with its tunned hyperparameters, is becoming more standardized. This wide search space is being explored by various methods like Bayesian Optimization or Genetic Programming. However, these algorithms can take a long time to finish their search.
Most of the times they aren’t as simple as fitting one model on the dataset; they are considering multiple machine learning algorithms (random forests, linear models, SVMs, etc.) in a pipeline with multiple preprocessing steps (missing value imputation, scaling, PCA, feature selection, etc.), the hyperparameters for all of the models and preprocessing steps, as well as multiple ways to ensemble or stack the algorithms within the pipeline.
As an example consider a Genetic Programming library to evolve an ML pipeline that considers various preprocessing steps and multiple machine learning algorithms; Assume a configuration of 100 generations with 100 population size; This would result in 10,000 model configurations to evaluate with 10-fold cross-validation, which means that roughly 100,000 models are fit and evaluated on the training data. This is a time-consuming procedure, even for simpler models like decision trees.
We need a tool to allows us to orchestrate a machine learning training pipeline at scale. Kubeflow Pipelines is such a tool, belonging to Google’s Kubeflow ML ecosystem, a project dedicated to making deployments of machine learning (ML) workflows on Kubernetes.
Kubeflow Pipelines is Kubernetes-native workflow orchestrator that builds on top of Argo Workflows; it isn’t a typical orchestrator in the sense that it knows the structure of a typical ML workflow and threfore it can provide features that leverage on that knowledge. It has a built-in Experiment concept that can be used to run a workflow with a set of parameters so that we can then track the associated performance metrics. It also allows a workflow to output
different artifacts that are used to assess the model performance/behavior.
Here’s an illustration of a workflow:
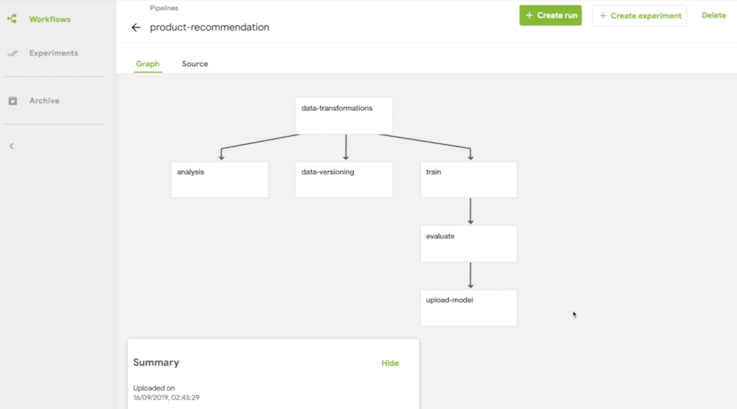
Every step runs in its own container, allowing us to: isolate software dependencies; optimize required resources for each step, and; easily parallelize parts of the workflow.
Model Serving
Once a training process results in a satisfactory model, the later should be made available at a central repository to facilitate its integration into a service.
We need a framework agnostic tool to rapidly deploy pipelines for model inference at scale. Note that, in the most general case, the transformations that occur at training time are not necessarily the same that we can afford to perform at inference time. There is some differentiation between transformation training and testing data; this is because training sets are typically enhanced by processing the full dataset all at once to extract meaningful information, while at inference time the data must be processed row by row (assuming a real-time system), leading to some information loss when compared to the training phase.
Moreover, we need a tool that provides us the flexibility to create inference pipelines that go beyond the traditional pattern of receiving the data and calling the model’s API. Here’s an illustration of a possible inference pipeline:
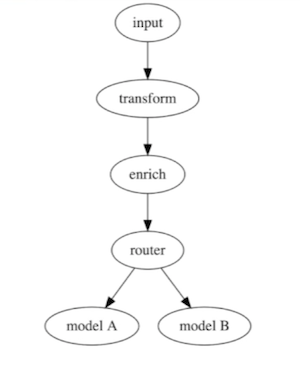
In this example the service receives some input data; transforms it to extract the relevant features; enriches the data with a query to some database to provide extra context; and then asks a prediction from multiple models.
Being able to create arbitrarily complex inference graphs creates the opportunity to generalize common behavior like creating generic steps for outlier detection or performing multi-armed bandits tests.
Seldon is a model serving framework that supports model deployment on a Kubernetes cluster. It allows for the creation of inference graphs, where each step runs as a different container.
Every graph has a model orchestration pod at the top with a standardized API contract for both REST and gRPC. When it receives a request (or a batch of requests) it then triggers the execution of the graph. The of the wiring between the steps is handled by Seldon.
We can also leverage Kubernetes inherent scalability capability to serve models at scale. Here’s the relevant part of a Seldon’s graph definition:
hpaSpec:
  minReplicas: 1
  maxReplicas: 4
    metrics:
      - type: Resource
        resource:
          name: cpu
          targetAverageUtilization: 0.80
This, in turn, will create a Horizontal Pod Autoscaler (HPA) rule in Kubernetes that monitors the service metrics. Once the metric threshold fails to be respected, a service replica is created to cope with the increased volume of traffic.
❯ kubectl get hpa --all-namespaces

NAMESPACE      NAME                          REFERENCE                                TARGETS   MINPODS   MAXPODS   REPLICAS   AGE
jx-staging     manticore-manticore-a0b1623   Deployment/manticore-manticore-a0b1623   39%/80%   1         4         1          28d
To expose the models to consumers outside of the cluster Seldon integrates with istio. Every time that the Seldon Kubernetes Operator detects a request for a Seldon deployment, it injects the necessary instructions to wire the service to istio. L7 Routing capability is also available via the integration with istio.
Each deployment exposes two default endpoints: predict and feedback:
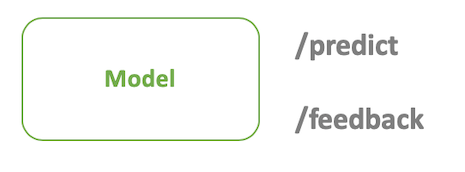
The predict is the one used to to retrieve an inference. We can use the feedback endpoint to capture responses when these are made available. The later is important for:
- Deciding which model should serve more traffic when running inference graphs with A/B or multi-armed bandits, given the current performance;
- Models supporting online-training;
- Capturing new labeled data to be used in retraining jobs;
Model Observability
Once a model is live, we do need to be able to monitor technical metrics like the number of requests/sec or the response latency.
However, data science teams should have to observe more functional metrics like the real-time performance of the model, the bias in the response or the distribution of the input data. This would provide useful insights to the teams to detect possible drifts in data distribution, or on how to make the model fairer.
Seldon provides an awesome integration with Grafana and Prometheus. For each Seldon Deployment, the Seldon’s Service Orchestrator exposes a set of default Prometheus metrics which are then displayed in a central Grafana dashboard.
Here’s an illutratrion of what this looks like:
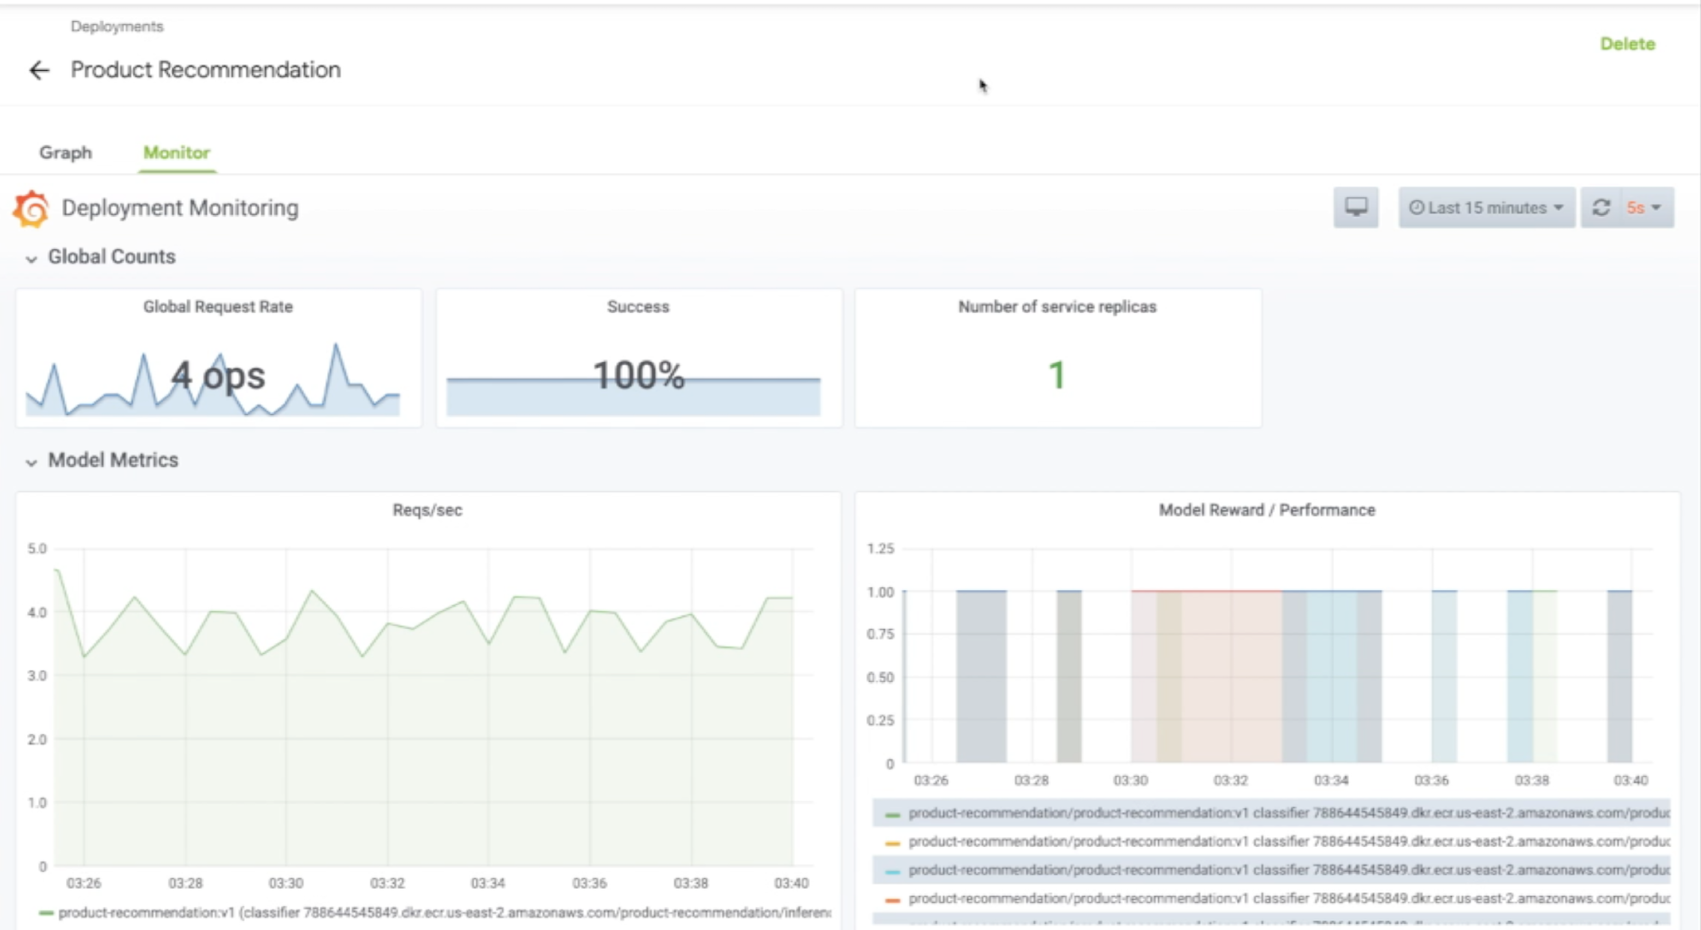
Custom metrics can be easily exposed and integrated in these dashboards. Seldon takes care of all of the wiring and communication among the services. At the dashboard level, we can select different deployments, versions or even particular containers that form an inference graph.
Governance
A model’s behavior is affected not only by its code and configuration but also by data consumed at training time. The following is a nonexhaustive list of what is needed to achieve governance when deploying ML services:
- Every Machine Learning Asset should be versioned. This includes code, data, configuration, models, inference graphs, etc.
- There should be visibility over the different experiments performed and associated metrics;
- Every model should be reproducible;
- We should be able to verify the results of a Machine Learning model to ensure we are only integrating models with acceptable performance;
- Rollback mechanisms should be in place;
An ML model is not much different from data: a set of learned weights along with some metadata. Any artifact storage solution should suffice to be used as a model repository. Nexus or an object-storage like MongoDB can be used as a model repository.
Experiment tracking can be done at the orchestrator level, e.g. Kubeflow Pipelines. If a more specialized service is needed, a ML Flow Tracking service can be used. The later is particularly relevant if we also need to track experiments made by data scientists at exploration phase, i.e. when they are exploring the data and testing out ideas. MLFlow provides a simple python/R library that can be integrated into a data scientist exploration environment to track performance metrics and parameters used.
e.g. (from python):
import mlflow

...

with mlflow.start_run():

    lr = ElasticNet(alpha=alpha, l1_ratio=l1_ratio, random_state=42)
    lr.fit(train_x, train_y)

    predicted_qualities = lr.predict(test_x)

    (rmse, mae, r2) = eval_metrics(test_y, predicted_qualities)

    # Print out ElasticNet model metrics
    print("Elasticnet model (alpha=%f, l1_ratio=%f):" % (alpha, l1_ratio))
    print("  RMSE: %s" % rmse)
    print("  MAE: %s" % mae)
    print("  R2: %s" % r2)

    # Set tracking_URI first and then reset it back to not specifying port
    # Note, we had specified this in an earlier cell
    mlflow.set_tracking_uri(mlflow_tracking_URI)

    # Log mlflow attributes for mlflow UI
    mlflow.log_param("alpha", alpha)
    mlflow.log_param("l1_ratio", l1_ratio)
    mlflow.log_metric("rmse", rmse)
    mlflow.log_metric("r2", r2)
    mlflow.log_metric("mae", mae)
    mlflow.sklearn.log_model(lr, "model")
With this service we can centralize the information related to every ML experiment:
- Experiments performed by the CICD infrastructure as a response to a data/code change;
- Experiments performed by data scientists while they are exploring new solutions;
The MLFlow artifact store can also be used as a model repository.
Treating a data change in the same way as a code change requires tooling to support some kind of formal data versioning. Pachyderm is a Kubernetes framework that can help with the engineering side of ML workflows. It can be used as kind of git for data.
This also means that our training workflows cannot explicitly consume the data when an execution is triggered. The consumption must be declarative and done via git.
By doing so, the CICD pipeline can respond in the same way to changes in both code and data.
Pachyderm provides an intuitive solution for data versioning. The following snippets illustrate the concept and the typical workflow when working with Pachyderm (via the patchctl CLI):
Create a data repository:
pachctl create repo product-recommendation
Commit data to master branch:
pachctl put file -r product-recommendation@master:/data -f data/
We can then list all of the different data versions of the master branch:
❯ pachctl list commit product-recommendation

REPO                   BRANCH COMMIT                           PARENT STARTED    DURATION           SIZE
product-recommendation master 70c9c944ed5f4d7286d5f16461d07c91 <none> 3 days ago Less than a second 52.4MiB
Note that master is just a pointer to the latest commit hash. To illustrate this consider the following example:
❯ pachctl list commit product-recommendation
REPO                   BRANCH COMMIT                           PARENT STARTED      DURATION           SIZE
product-recommendation master e37161e974e8482bbccc89e01b414f7c <none> 26 hours ago Less than a second 3.768KiB
product-recommendation master c3f0233361fd43f39f532ec6859001c8 <none> 26 hours ago 1 second           3.768KiB
The folllowing commands are equivalent:
pachctl get file product-recommendation@master:/data/ --recursive --output .
pachctl get file product-recommendation@e37161e974e8482bbccc89e01b414f7c:/data/ --recursive --output .
Every change must have associated a particular version of the code and data. This is why the data cannot be consumed directly and must be done via git.
A simple way would be to have the data version as a configuration in the repository:
/configuration/data.json
{
  "train": {
      "commit": "befcd45a69704b3094f10a031ffaf398"
  }
}
The CICD pipeline would be triggered in two ways:
- 1 - Code Change
The team changes the logic of the model training process, e.g. new features, more complex models, etc.
- 2 - Data Changes
Every time data changes, a pipeline must be triggered that will version it in Pachyderm and commit a change to the relevant repositories by changing train.commit in /configuration/data.json; this, in turn, will trigger an execution of the training process.
Data Exploration
Teams require the ability to create data exploration environments, from which they can access the data to research possible solutions to the problems they are working on. Special purpose hardware like GPUs should also be made available on-demand when needed.
Different flavors of these environments, with different technological stacks, can provide development velocity and flexibility to different teams.
JupyterHub or Anaconda are well-known tools that provide exploratory user-sessions on top of Kubernetes.
CICD
Jenkins X is Kubernetes native and can be used for integration and deployment. It creates a concise system where the integrations pipelines run inside of the same cluster. It supports environment promotion, with multiple deployment strategies, via GitOps, which gives us the ability to perform declarative application deployments via Git.
Workflow Diagram
The following diagram depicts the end-to-end workflow. Every step then is detailed below.
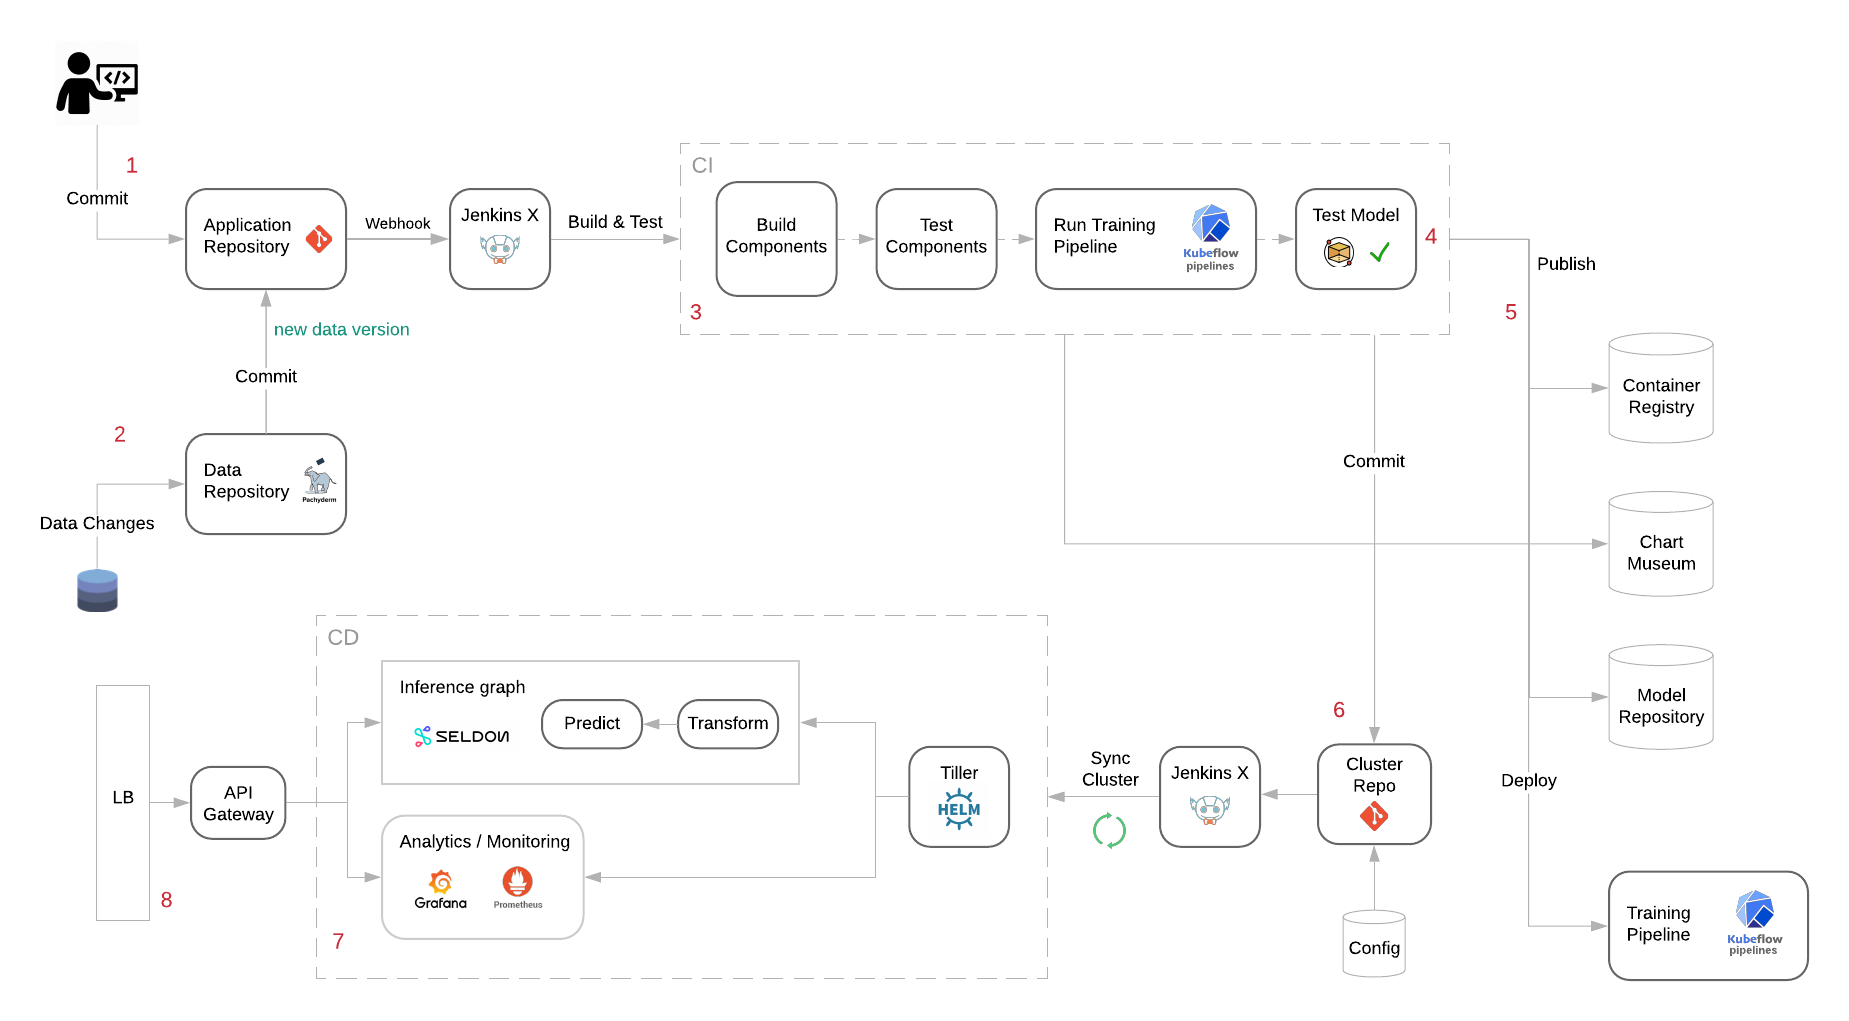
Once a project is integrated into the platform, the integration pipeline is triggered either via a code (1) or a data change (2).
At building stage (3) we build every step of the Kubeflow ML training workflow as well as every step of the Seldon’s Inference Graph; we should have unit tests for every individual component and more comprehensive tests for the model that will compare the model’s predictions against a known set of cases (4); if the model does not perform successfully, the integration pipeline fails.
We then publish every build artifact to their respective repositories (5):
- Push all of the images belonging to the Kubeflow training pipeline and Seldon’s Inference Graph to a registry.
- Publish a new version of a Helm Chart containing the new version of the service (Seldon Deployment Object).
- Push the new model version to the model repository;
- Deploy the new version of the training pipeline to the Kubeflow server.
The staging environment repository should then be updated with the new version of the application (6). The deployment is performed declaratively via the Jenkins X Kubernetes operator, which synchronizes the repository state with the cluster applicational state.
A new version of the service is then deployed (7), consisting of the following assets:
- Kubeflow workflow hat represents the training process and can be triggered manually with new inputs;
- A model inference graph that can serve requests (or batches of requests) via
RESTorgRPC; - Horizontal Pod Autoscaler (HPA) rule to ensure the scalability of the service;
- A Grafana dashboard with default visualizations like the number of requests/sec, model latency or model performance (if signal available);
- An Istio VirtualService;
The model is exposed to be consumed outside of the cluster through a Load Balancer (8) (either L4 or L7).
After this the service is ready to be tested at the staging environment. It can then be easily promoted to the next environment once the tests at the staging environment are complete.